How to Write a Performance Test
The performance test is a special form of Test, besides being a standard test suite, it also needs to output the performance metrics in OpenTelemetry JSON file format, and the results will be uploaded to the backend and displayed in the Performance dashboards for further analysis.
A typical workflow includes:
- Write a performance test suite
- Add the test suite
- Execute the test suite
- View the results
Terminology
- OpenTelemetry(OTEL) - An Observability framework and toolkit designed to create and manage telemetry data such as traces, metrics, and logs. We leverage its metrics protocol and Software Development Kit (SDK) for the reporting of results.
- ClickHouse - A fast open-source column-oriented database management system that allows generating analytical data reports in real-time using SQL queries. This is the backend that stores the Performance results.
Writing a Performance Test Suite
Writing a performance test suite is very similar to writing a standard test, with a few additions steps to produce a JSON file encompassing all performance metrics. The example below uses Python as the runtime, however, the underlying concept is applicable to other programming languages and test frameworks.
-
Proceed with the Writing a New Test Suite instructions to create the test suite.
-
Install dependencies. One way of achieving this is through the shell script executed by the test suite.
Click for example
python3 -m pip install opentelemetry-sdk
python3 -m pip install opentelemetry-exporter-otlp-proto-common
python3 -m pip install protobuf
python3 -m pip install JSON-minify -
Create an OpenTelemetry file exporter to export OTEL metrics data into a JSON lines file named
perf.jsonl. In scenarios involving concurrent execution of multiple tests, ensure that the exporter writes to the same file while maintaining each line as a valid JSON in OTEL metrics format.Click for code example
import time
from os import linesep
from os.path import splitext, basename
import psutil

from opentelemetry.metrics import (
    get_meter_provider,
    set_meter_provider,
    CallbackOptions,
    Observation,
)
from opentelemetry.sdk.metrics import MeterProvider
from opentelemetry.sdk.metrics.export import (
    PeriodicExportingMetricReader,
    ConsoleMetricExporter,
    MetricsData,
)
from opentelemetry.exporter.otlp.proto.common._internal.metrics_encoder import encode_metrics
from google.protobuf.json_format import MessageToJson
from json_minify import json_minify

metrics_log_path = "perf.jsonl"

# Callback to gather cpu usage
def get_cpu_usage_callback(_: CallbackOptions):
    for (number, percent) in enumerate(psutil.cpu_percent(percpu=True)):
        attributes = {"cpu_number": str(number)}
        yield Observation(percent, attributes)

def json_formatter(metric_data: MetricsData) -> str:
    export_metrics_service_request = encode_metrics(metric_data)
    json_msg = MessageToJson(message=export_metrics_service_request)
    return json_minify(json_msg) + linesep

# For more information about OTel JSON serialization, see:
# https://opentelemetry.io/docs/specs/otel/protocol/file-exporter/#json-file-serialization
# https://jsonlines.org
exporter = ConsoleMetricExporter(
    out=open(metrics_log_path, "w"),
    formatter=json_formatter,
)

# The PeriodicExportingMetricReader takes the preferred aggregation
# from the passed in exporter
reader = PeriodicExportingMetricReader(
    exporter,
    export_interval_millis=500,
)

provider = MeterProvider(metric_readers=[reader])
set_meter_provider(provider)

meter = get_meter_provider().get_meter(splitext(basename(__file__))[0], "1.0.0")

def test_get_cpu_usage():
    cpu_gauge = meter.create_observable_gauge(
        callbacks=[get_cpu_usage_callback],
        name="cpu_percent",
        description="per-cpu usage",
        unit="1"
    )

    time.sleep(10)
This example will generate a file with contents similar to the following:
Click for result example
{"resourceMetrics":[{"resource":{"attributes":[{"key":"telemetry.sdk.language","value":{"stringValue":"python"}},{"key":"telemetry.sdk.name","value":{"stringValue":"opentelemetry"}},{"key":"telemetry.sdk.version","value":{"stringValue":"1.22.0"}},{"key":"service.name","value":{"stringValue":"unknown_service"}}]},"scopeMetrics":[{"scope":{"name":"otel_metrics_example","version":"1.0.0"},"metrics":[{"name":"cpu_percent","description":"per-cpu usage","unit":"1","gauge":{"dataPoints":[{"timeUnixNano":"1705621619430845000","asDouble":0.0,"attributes":[{"key":"cpu_number","value":{"stringValue":"0"}}]},{"timeUnixNano":"1705621619430845000","asDouble":0.0,"attributes":[{"key":"cpu_number","value":{"stringValue":"1"}}]},{"timeUnixNano":"1705621619430845000","asDouble":0.0,"attributes":[{"key":"cpu_number","value":{"stringValue":"2"}}]},{"timeUnixNano":"1705621619430845000","asDouble":0.0,"attributes":[{"key":"cpu_number","value":{"stringValue":"3"}}]},{"timeUnixNano":"1705621619430845000","asDouble":0.0,"attributes":[{"key":"cpu_number","value":{"stringValue":"4"}}]},{"timeUnixNano":"1705621619430845000","asDouble":0.0,"attributes":[{"key":"cpu_number","value":{"stringValue":"5"}}]},{"timeUnixNano":"1705621619430845000","asDouble":0.0,"attributes":[{"key":"cpu_number","value":{"stringValue":"6"}}]},{"timeUnixNano":"1705621619430845000","asDouble":0.0,"attributes":[{"key":"cpu_number","value":{"stringValue":"7"}}]}]}}]}]}]}
{"resourceMetrics":[{"resource":{"attributes":[{"key":"telemetry.sdk.language","value":{"stringValue":"python"}},{"key":"telemetry.sdk.name","value":{"stringValue":"opentelemetry"}},{"key":"telemetry.sdk.version","value":{"stringValue":"1.22.0"}},{"key":"service.name","value":{"stringValue":"unknown_service"}}]},"scopeMetrics":[{"scope":{"name":"otel_metrics_example","version":"1.0.0"},"metrics":[{"name":"cpu_percent","description":"per-cpu usage","unit":"1","gauge":{"dataPoints":[{"timeUnixNano":"1705621619951588000","asDouble":25.5,"attributes":[{"key":"cpu_number","value":{"stringValue":"0"}}]},{"timeUnixNano":"1705621619951588000","asDouble":25.5,"attributes":[{"key":"cpu_number","value":{"stringValue":"1"}}]},{"timeUnixNano":"1705621619951588000","asDouble":6.0,"attributes":[{"key":"cpu_number","value":{"stringValue":"2"}}]},{"timeUnixNano":"1705621619951588000","asDouble":4.0,"attributes":[{"key":"cpu_number","value":{"stringValue":"3"}}]},{"timeUnixNano":"1705621619951588000","asDouble":3.8,"attributes":[{"key":"cpu_number","value":{"stringValue":"4"}}]},{"timeUnixNano":"1705621619951588000","asDouble":1.9,"attributes":[{"key":"cpu_number","value":{"stringValue":"5"}}]},{"timeUnixNano":"1705621619951588000","asDouble":1.9,"attributes":[{"key":"cpu_number","value":{"stringValue":"6"}}]},{"timeUnixNano":"1705621619951588000","asDouble":0.0,"attributes":[{"key":"cpu_number","value":{"stringValue":"7"}}]}]}}]}]}]}
{"resourceMetrics":[{"resource":{"attributes":[{"key":"telemetry.sdk.language","value":{"stringValue":"python"}},{"key":"telemetry.sdk.name","value":{"stringValue":"opentelemetry"}},{"key":"telemetry.sdk.version","value":{"stringValue":"1.22.0"}},{"key":"service.name","value":{"stringValue":"unknown_service"}}]},"scopeMetrics":[{"scope":{"name":"otel_metrics_example","version":"1.0.0"},"metrics":[{"name":"cpu_percent","description":"per-cpu usage","unit":"1","gauge":{"dataPoints":[{"timeUnixNano":"1705621620496494000","asDouble":25.5,"attributes":[{"key":"cpu_number","value":{"stringValue":"0"}}]},{"timeUnixNano":"1705621620496494000","asDouble":20.0,"attributes":[{"key":"cpu_number","value":{"stringValue":"1"}}]},{"timeUnixNano":"1705621620496494000","asDouble":61.1,"attributes":[{"key":"cpu_number","value":{"stringValue":"2"}}]},{"timeUnixNano":"1705621620496494000","asDouble":36.4,"attributes":[{"key":"cpu_number","value":{"stringValue":"3"}}]},{"timeUnixNano":"1705621620496494000","asDouble":24.1,"attributes":[{"key":"cpu_number","value":{"stringValue":"4"}}]},{"timeUnixNano":"1705621620496494000","asDouble":18.2,"attributes":[{"key":"cpu_number","value":{"stringValue":"5"}}]},{"timeUnixNano":"1705621620496494000","asDouble":7.3,"attributes":[{"key":"cpu_number","value":{"stringValue":"6"}}]},{"timeUnixNano":"1705621620496494000","asDouble":1.9,"attributes":[{"key":"cpu_number","value":{"stringValue":"7"}}]}]}}]}]}]}
Adding the Test Suite
See Adding a Job Package. Note that test suite is just a job package that contains one or more tests.
Executing the Test Suite
See Executing the test.
Viewing the Results
There are several approaches to visualize the results.
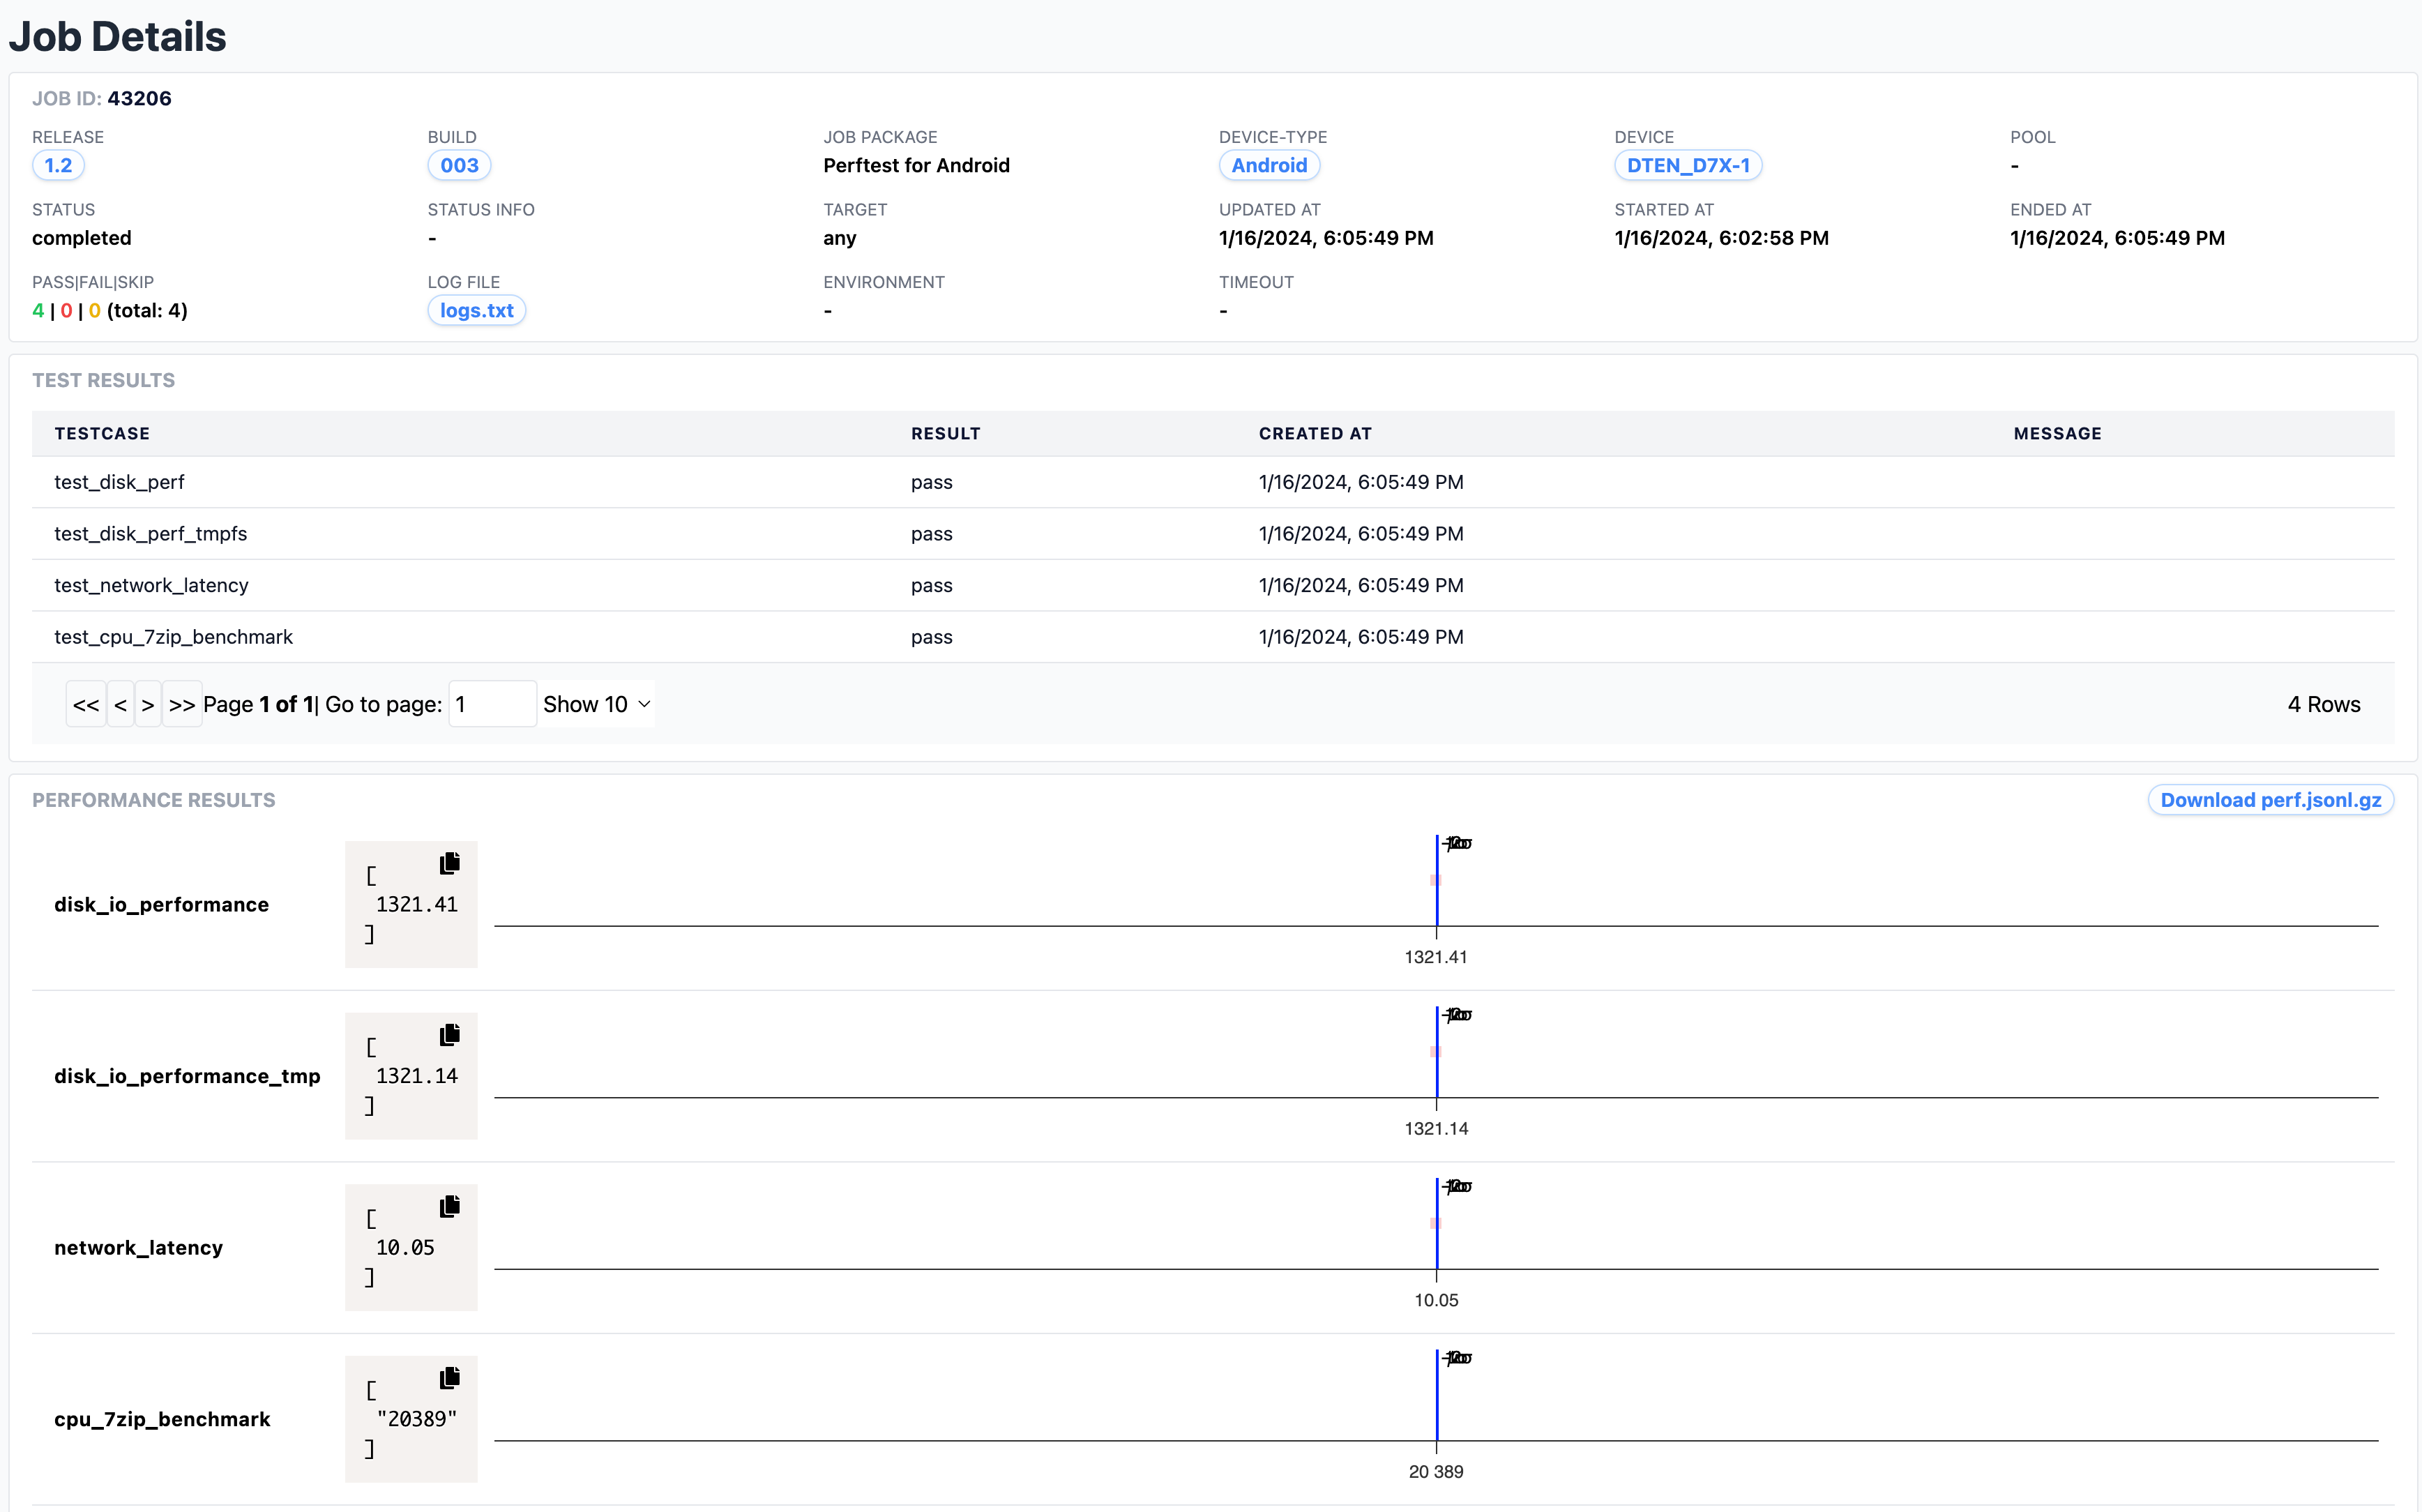
Job View
To view the results of a single job, follow these steps:
- Navigate to the LabScale home screen and select the Projects from the left-side navigation bar.
- Select the specific project of interest from the list.
- Click on the Jobs in the left-side navigation bar.
- Choose the job you want to review. Pending or ongoing jobs can be found under the Active tab while completed jobs are listed under the Completed tab.
- Explore the performance test results displayed at the bottom of the page.
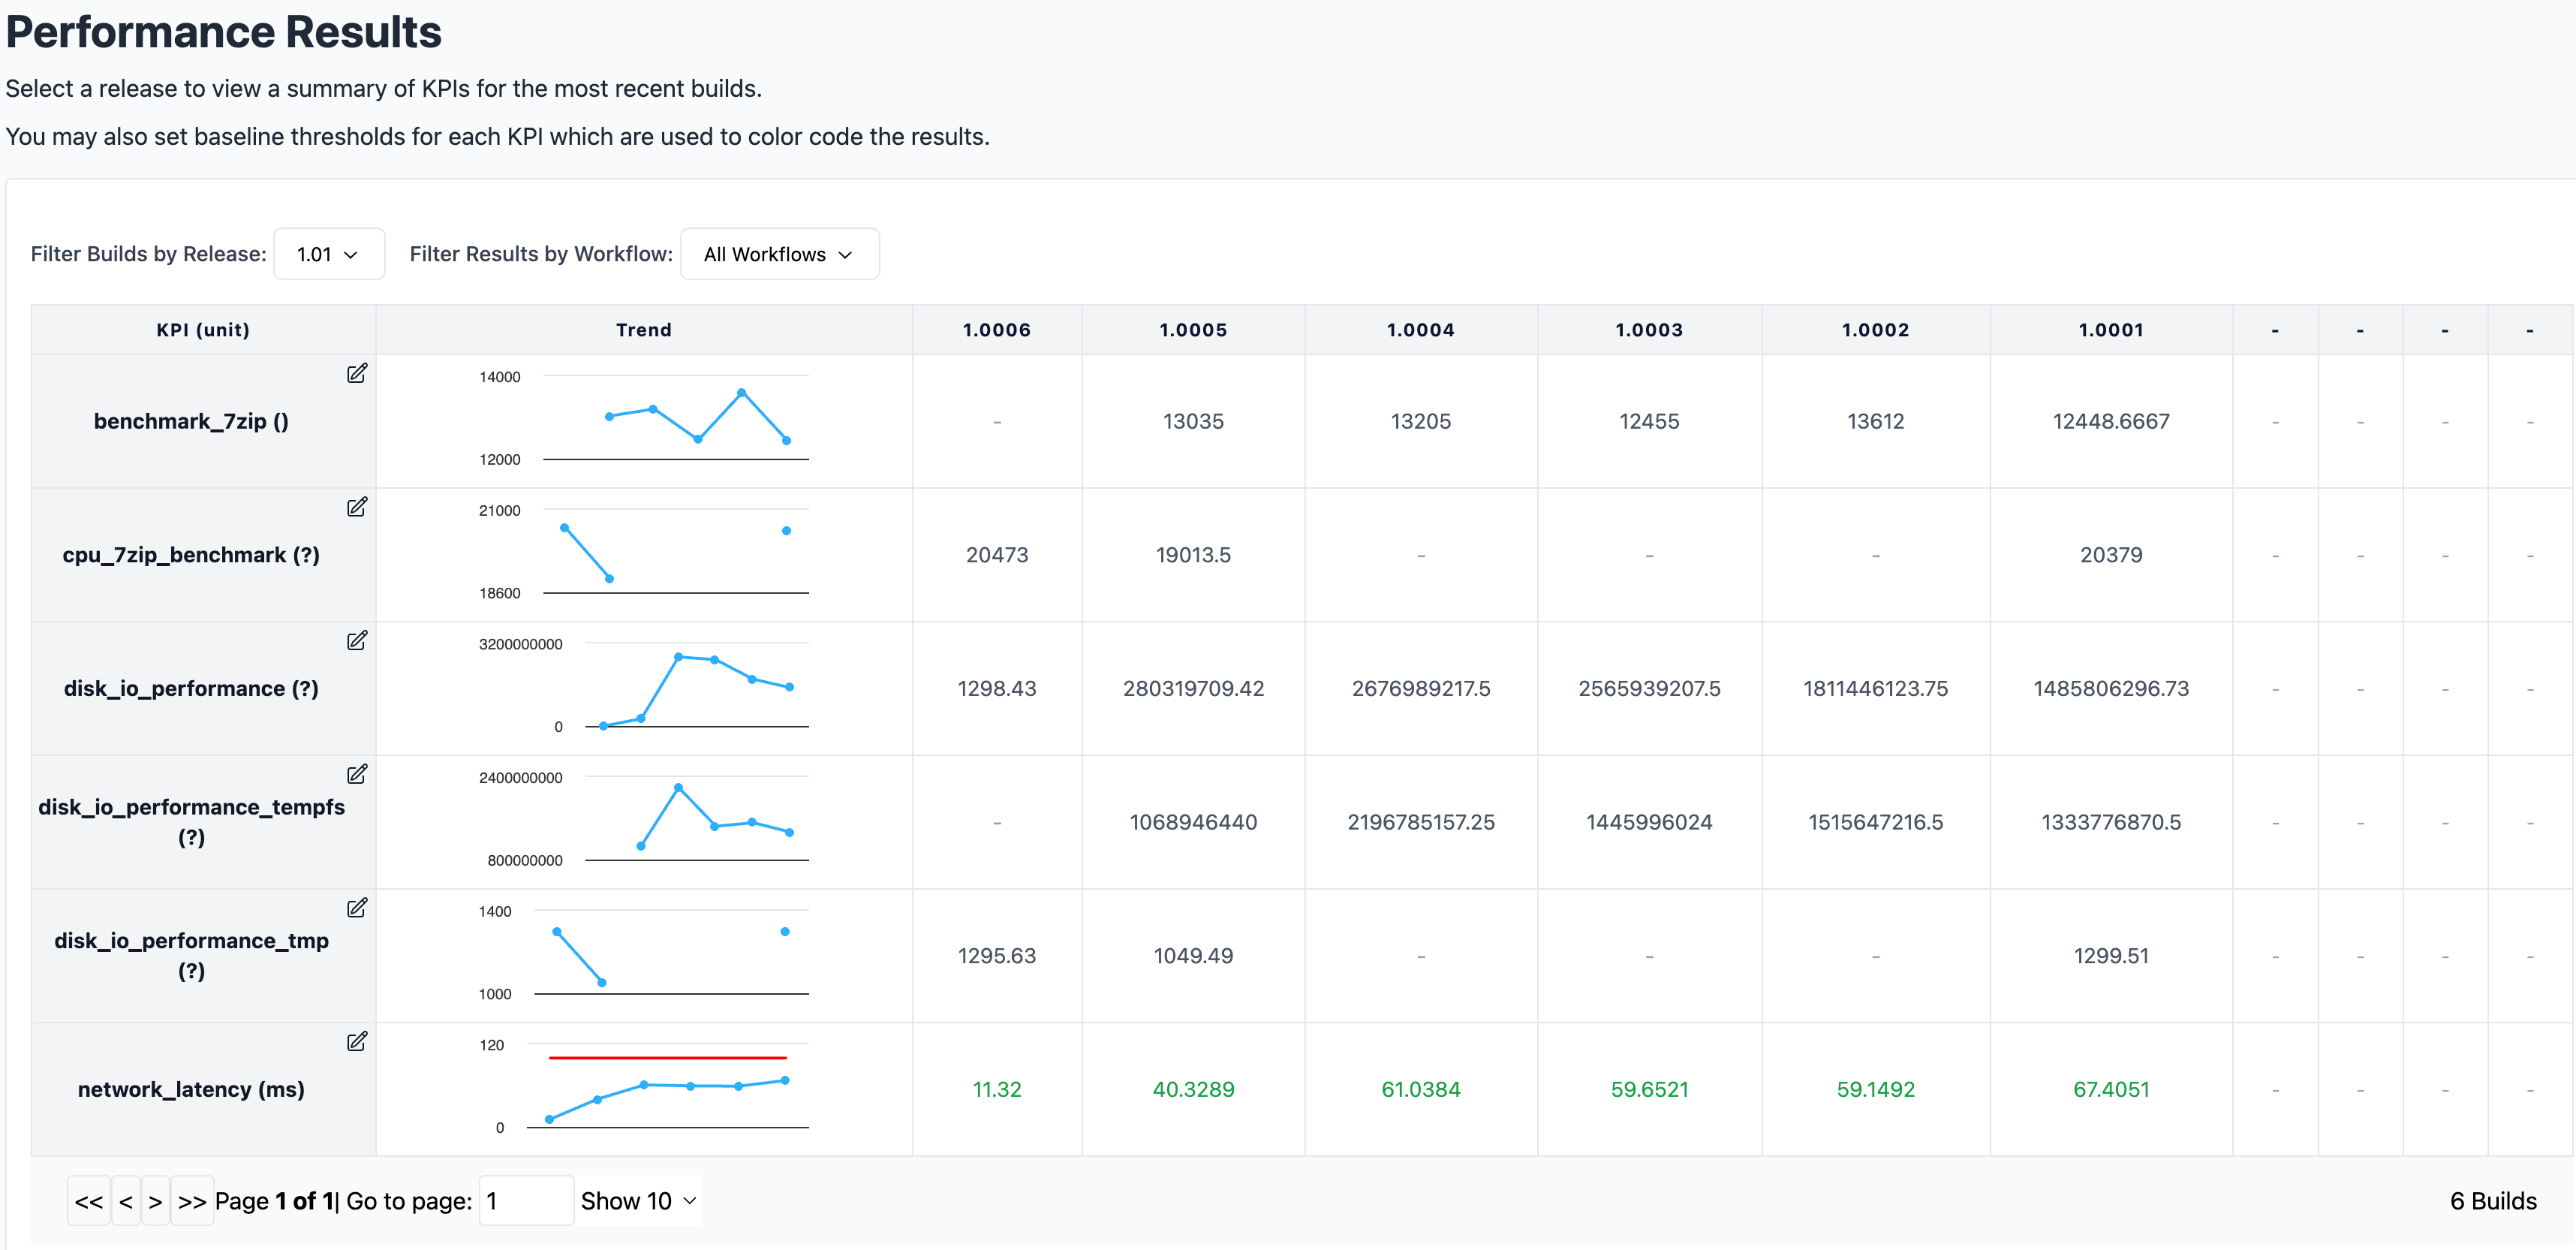
Release/Workflow View
To view the results by release/workflow across builds and validate data is within the predefined ranges, follow these steps:
- Navigate to the LabScale home screen and select the Projects from the left-side navigation bar.
- Select the specific project of interest from the list.
- Click on the Performance Results in the left-side navigation bar.
- Choose the target release and workflow from the respective drop-down menus at the top.
- To modify the metadata of the metrics, click the Edit button (notepad
icon) located on the top right of the metric name. This allows adjustments
to:
- Description: Description of the metric.
- Unit: The unit of the metric (e.g., MBps, ms, etc.).
- Min Threshold: Specify a minimum threshold, and value less than the threshold is considered out of range; leave blank if no minimum threshold is set..
- Max Threshold: Specify a maximum threshold, and value greater than the threshold is considered out of range; leave blank if no maximum threshold is set.
Color of the Values
- Default: No thresholds set.
- GREEN: Data within defined thresholds
- RED: Data exceeds defined thresholds